LineProfile_Horizontal
-> go to [LineProfile_Top]

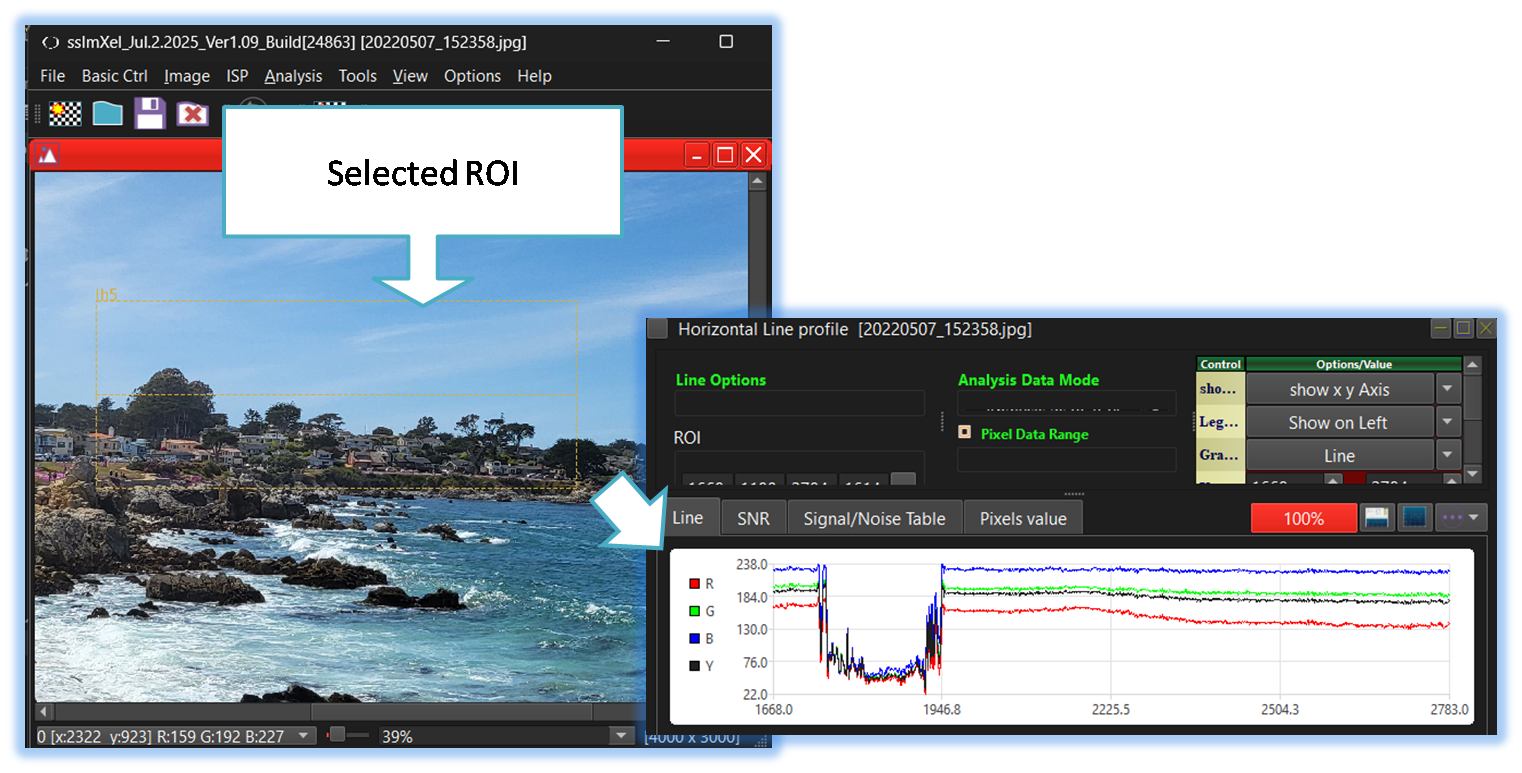
A Horizontal Line Profile displays variations in pixel intensity along a selected row or across averaged column values in an image, enabling analysis of brightness fluctuations, noise artifacts, and fixed pattern distortions.

-
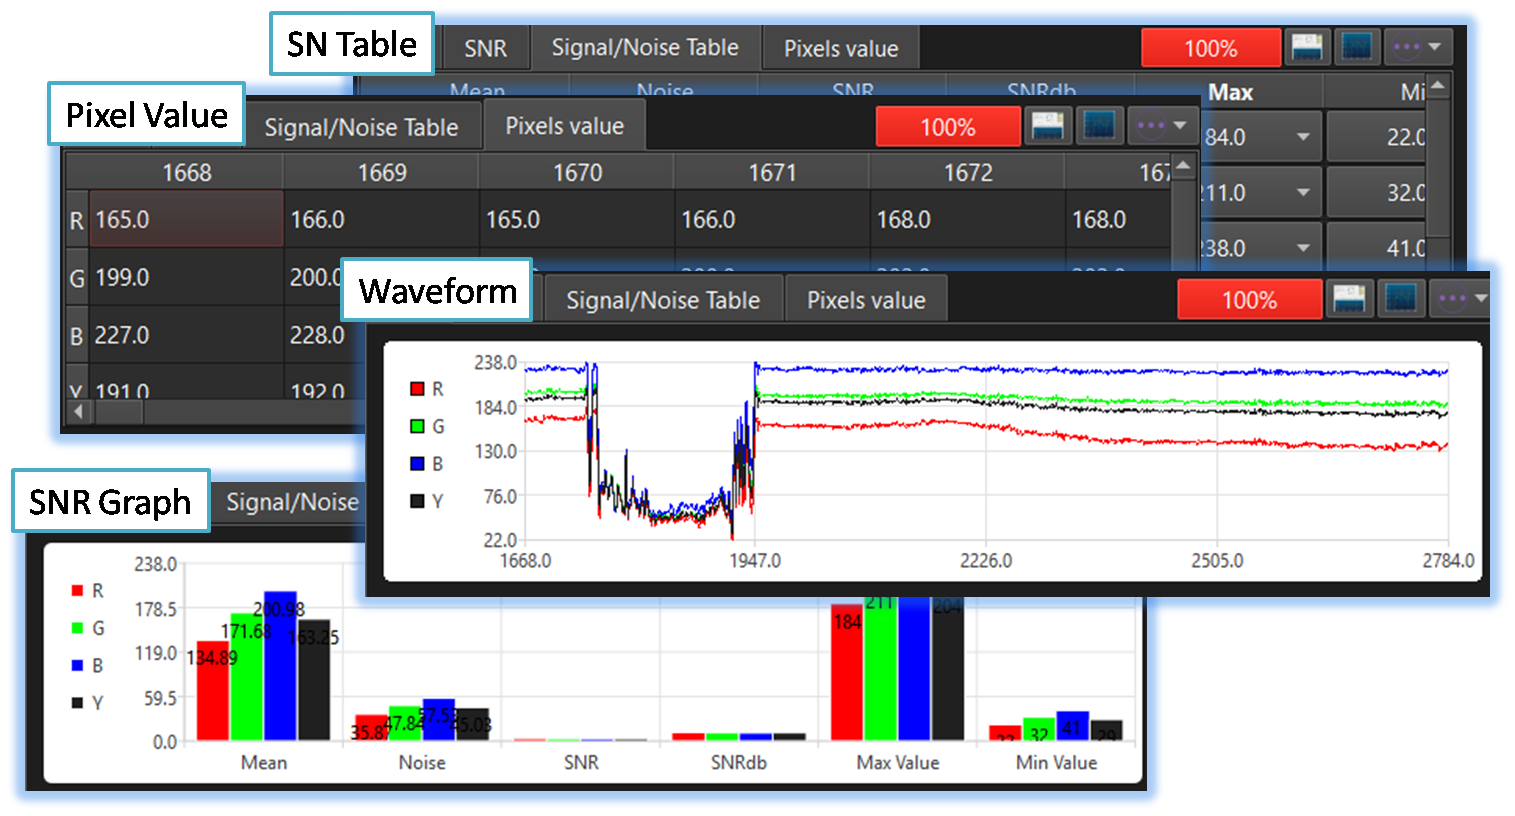
Various analysis functions related to horizontal line data.
In addition to line waveform analysis, the tool also provides SNR graphs and tables, as well as detailed pixel values, offering rich insights for image evaluation.


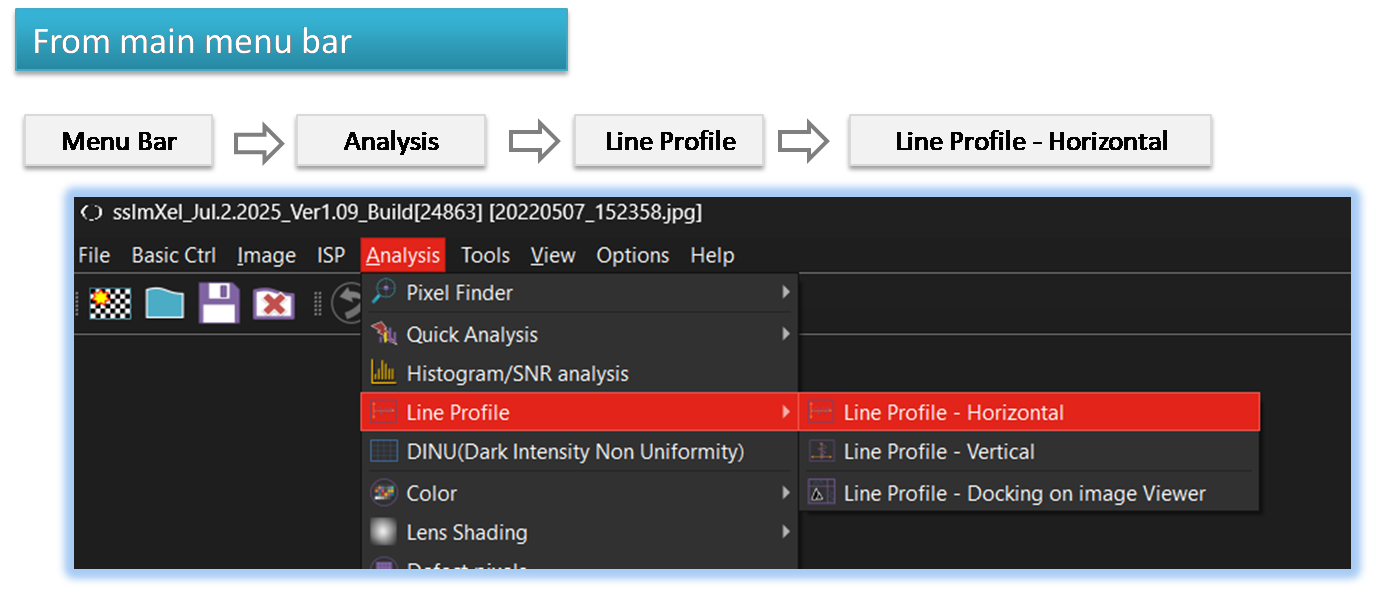
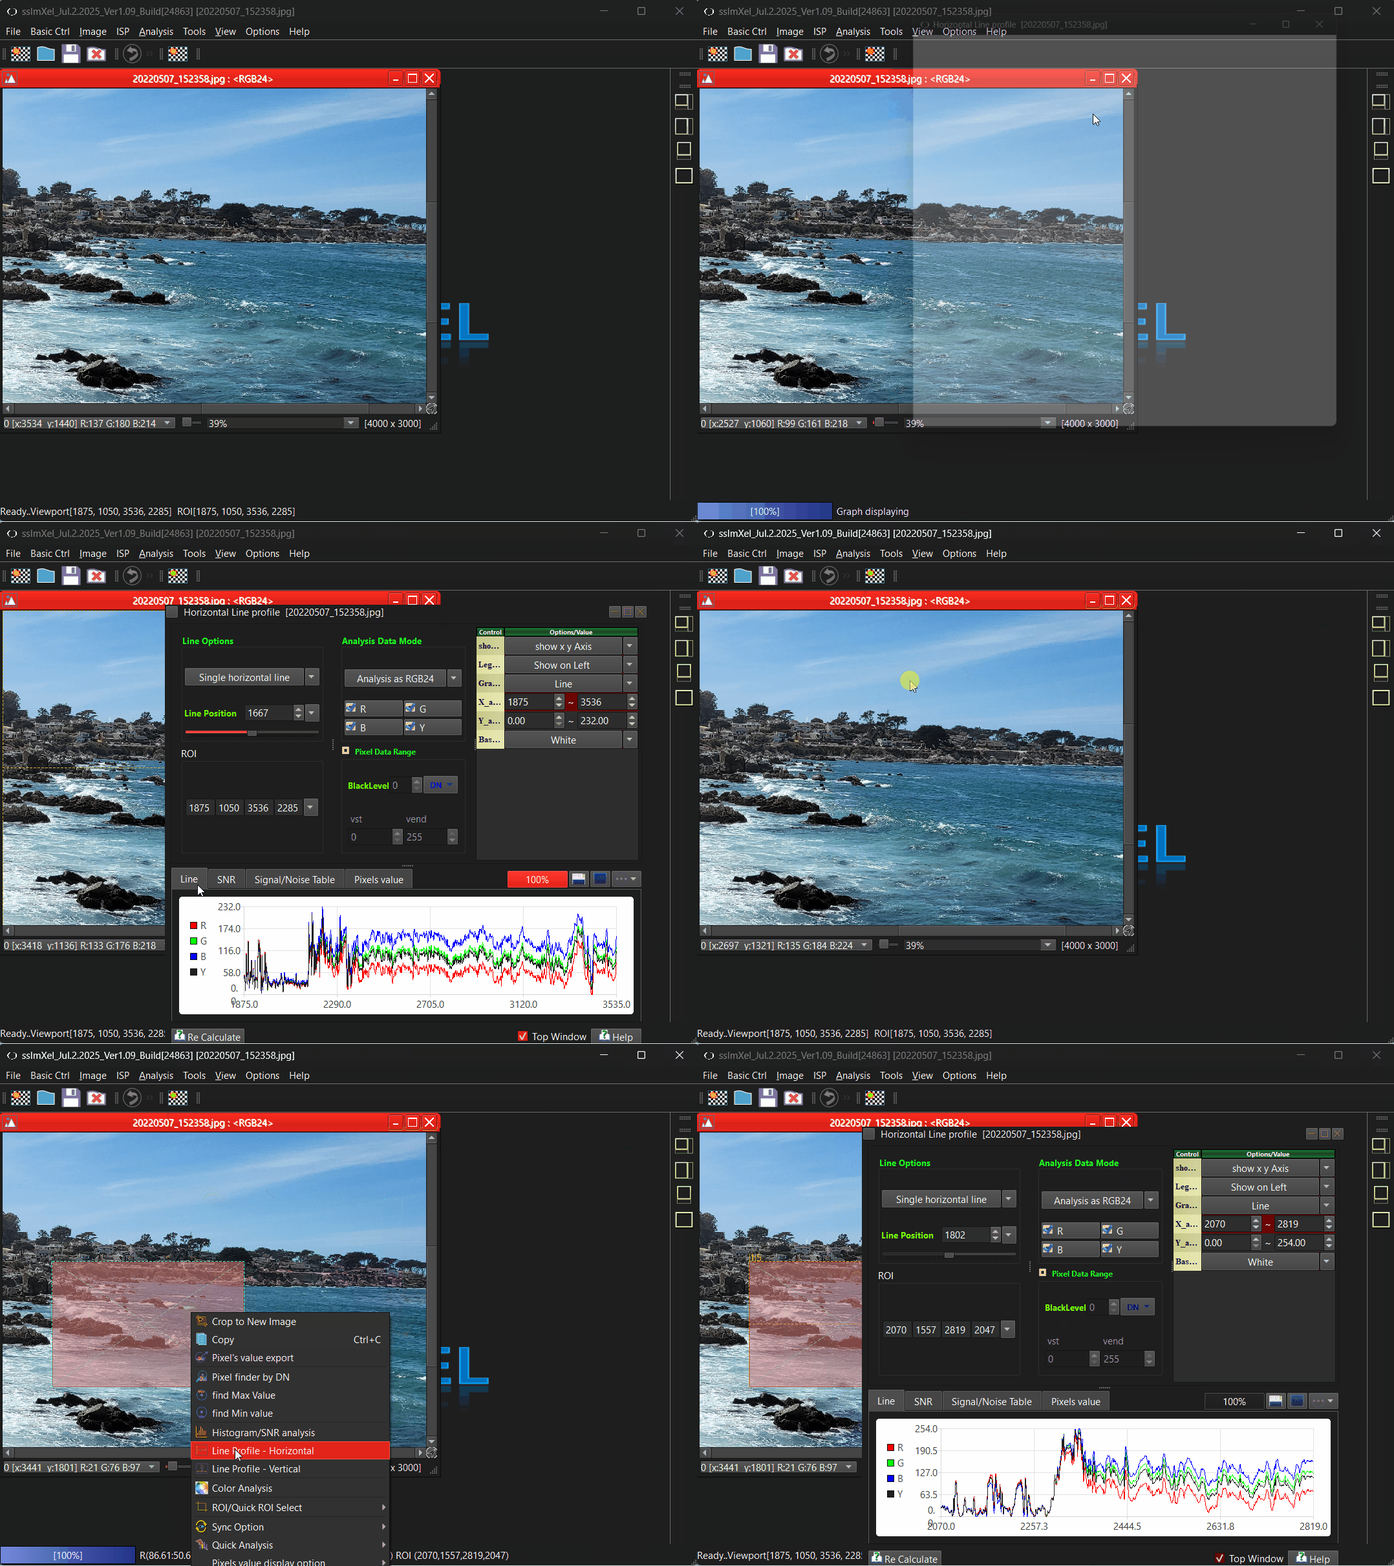
By selecting the menu options in the order shown in the image above or by choosing the toolbar icon
 ,
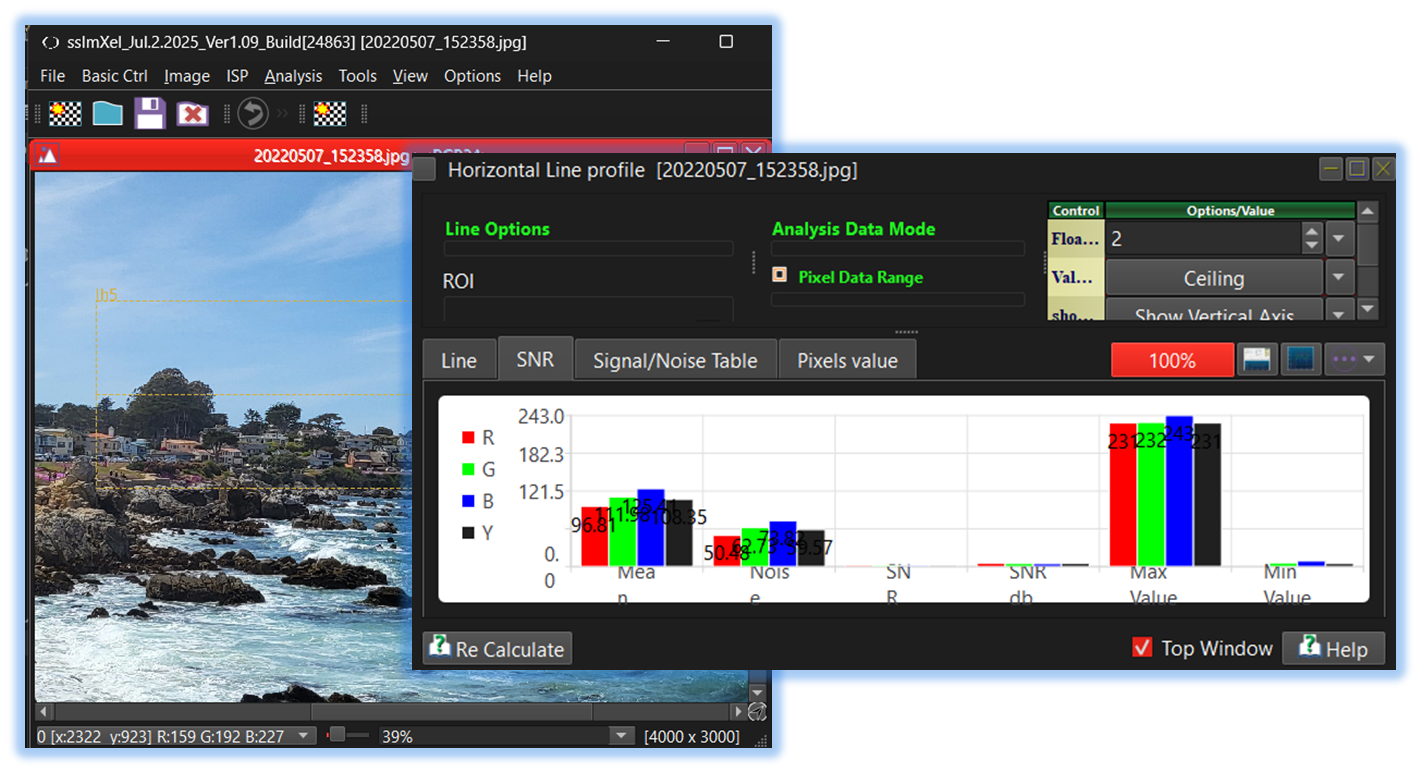
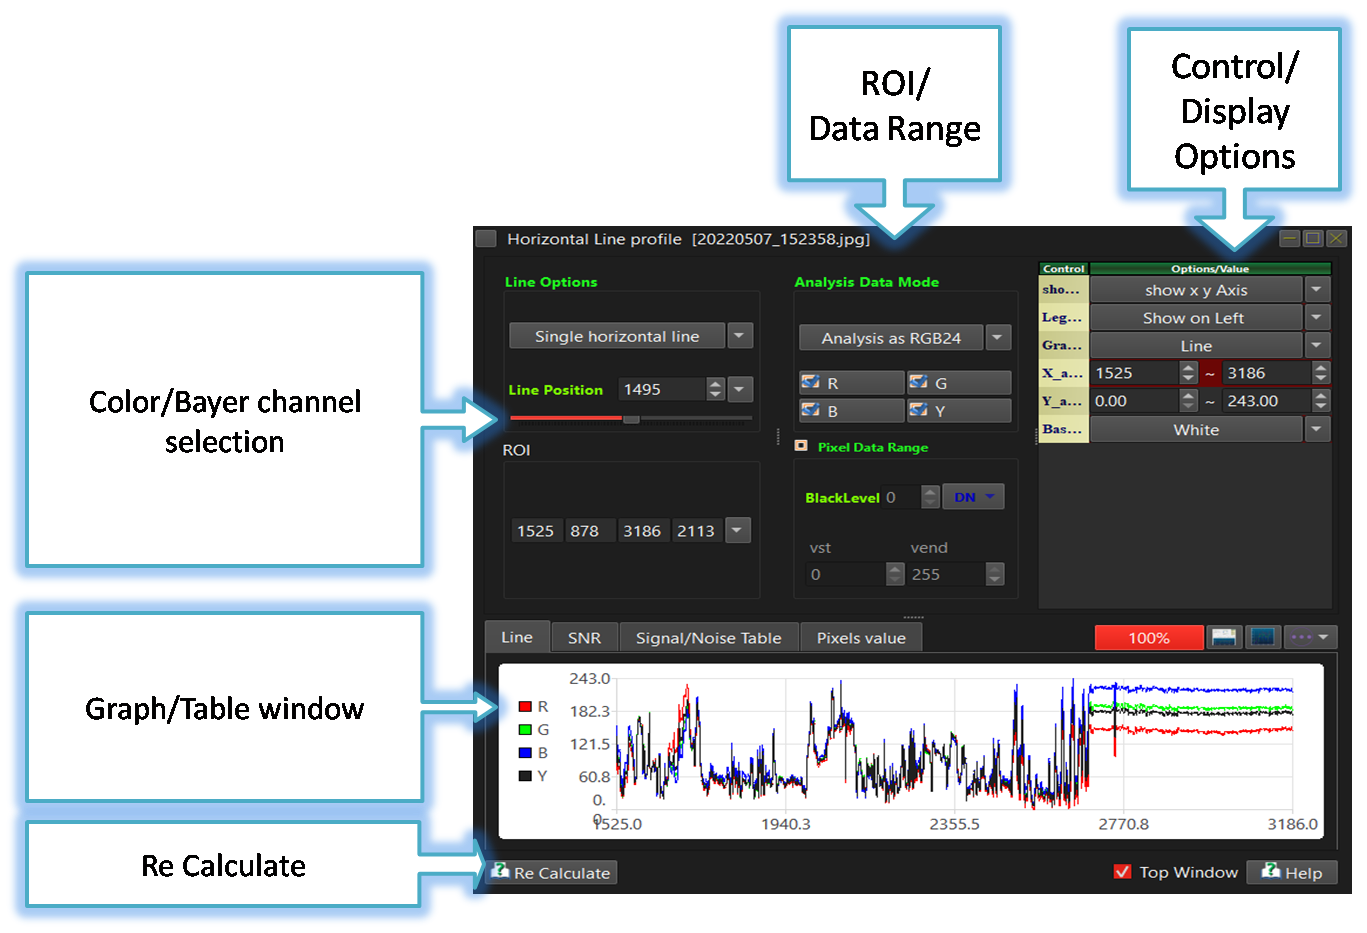
the LineProfile_Horizontal dialog box will be showed up as shown in below picture.
,
the LineProfile_Horizontal dialog box will be showed up as shown in below picture.
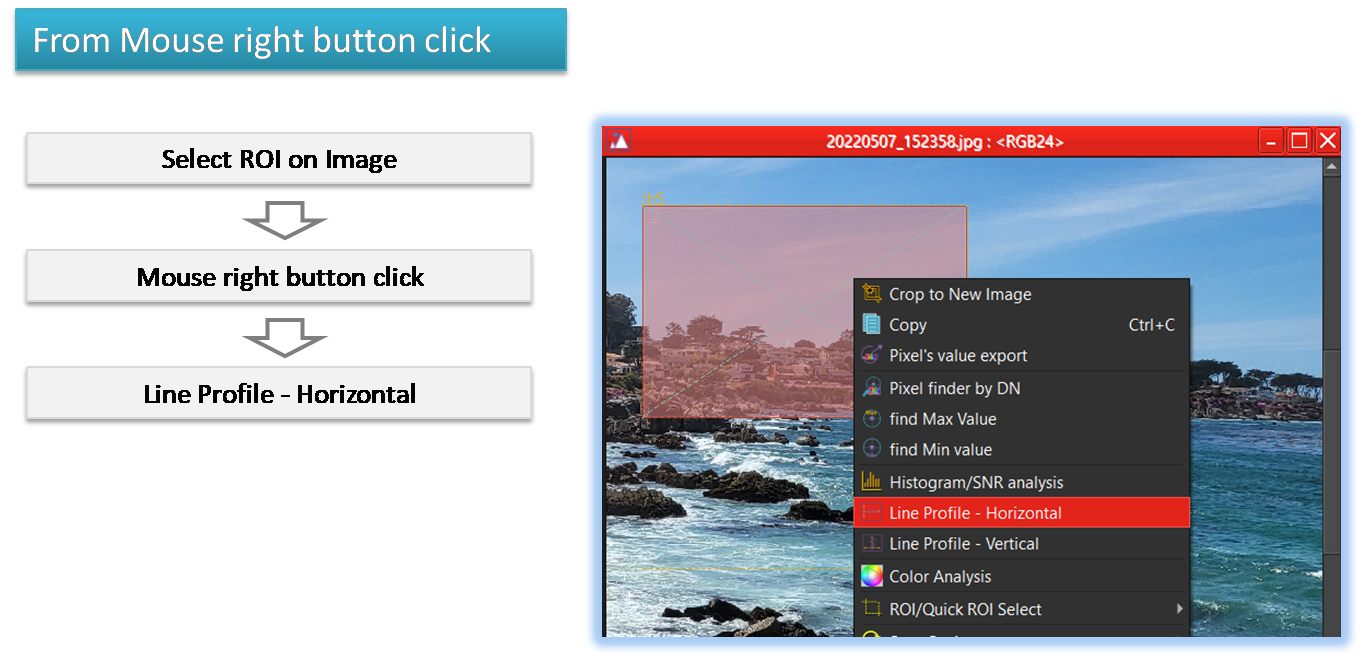
or After the user selects an ROI (Region of Interest) on the working image and clicks the mouse right button, the LineProfile_Horizontal dialog box will appear, as shown in the image below.
For a more detailed explanation of the toolbar button or how to configure toolbar,please refer to configure toolbar

-
Analysis_Data_Mode
This control allows the user to select specific channels for analysis. For Bayer raw images, the analysis can be performed in either Bayer raw mode or RGB24 mode. Within each mode, the user can further select the desired color or pattern channels for analysis.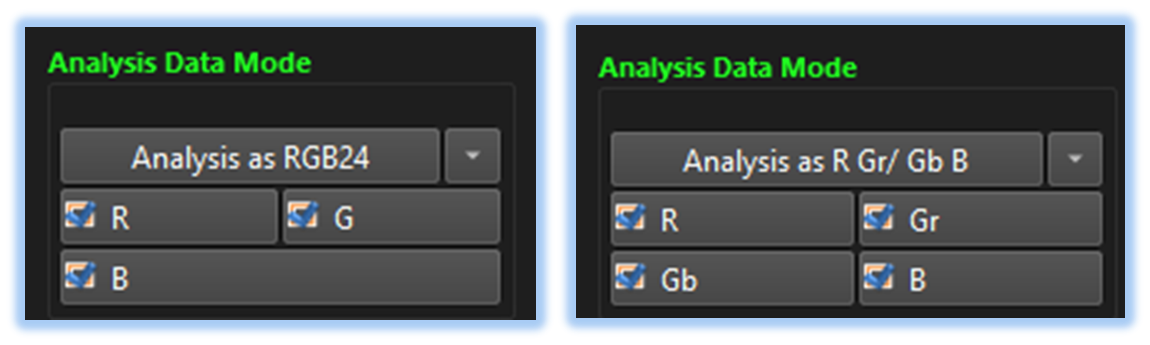
-
ROI
By allowing users to specify a Region of Interest (ROI) in addition to analyzing the entire image, the analysis speed can be increased, and the accuracy of the analysis can be improved by focusing only on the areas of interest.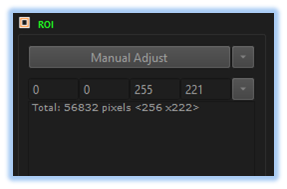
-
Pixel Value Range
This control allows the user to define the pixel value range and set the black level for analysis.

Below demo demonstrates LineProfile_Horizontal
 .
.