Analysis
-> go to [Menu Home]

The tool offers various analysis functions for evaluating image quality, including signal-to-noise characteristics, DINU, color metrics, shading factors, and defect pixel identification.
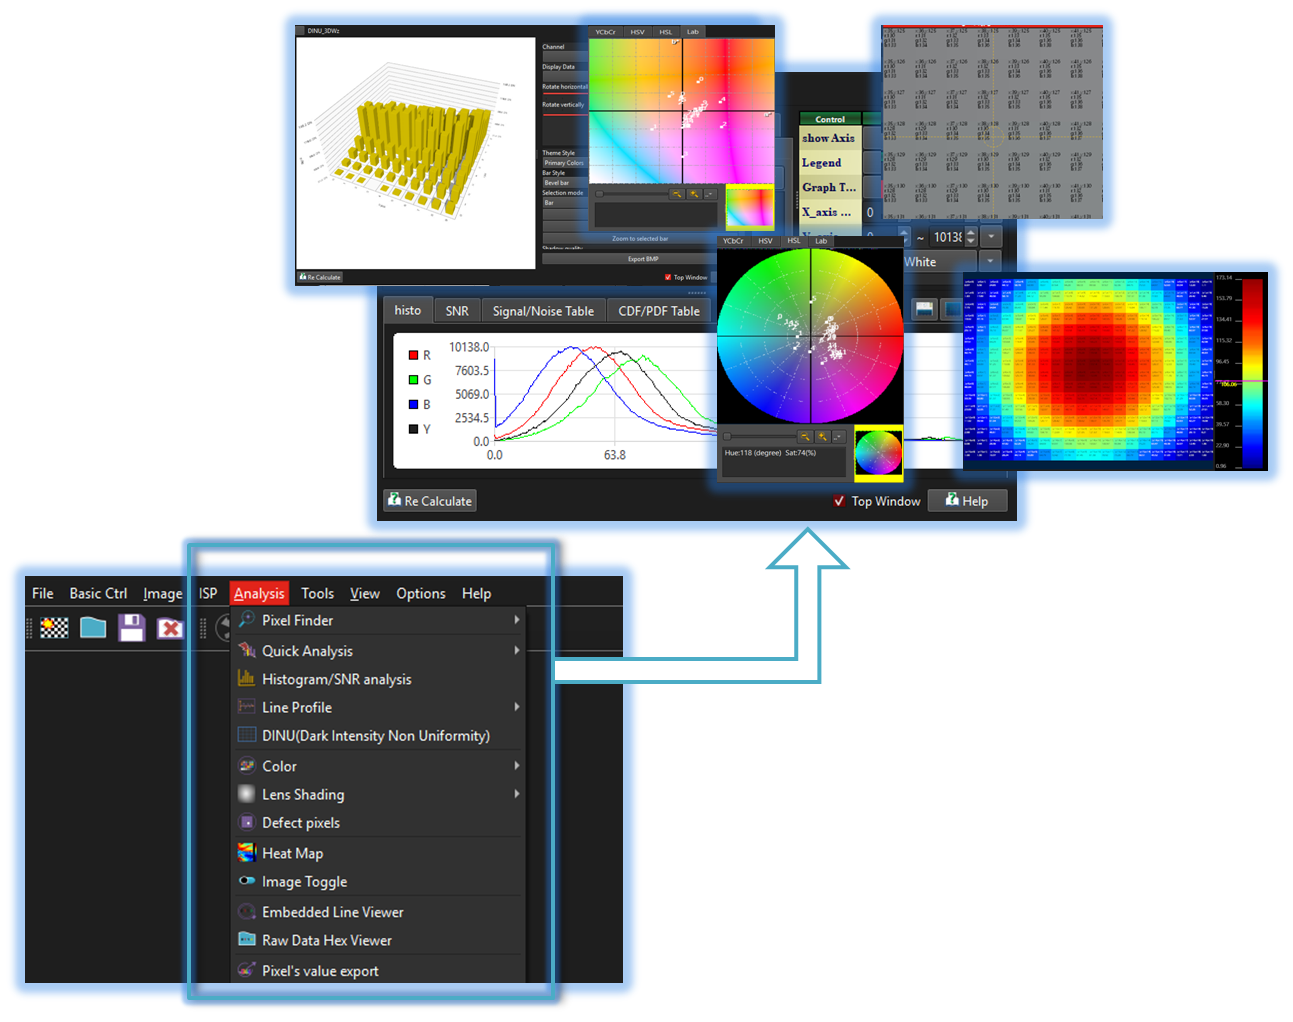
-
Pixel Finder
Efficiently locate or navigate to specific pixels based on position or value range. -
Quick Analysis
Quickly inspect signal and noise in an image. -
Histogram/SNR Analysis
analyze signal characteristics, noise levels, and signal-to-noise ratio (SNR) in image data through pixel intensity histograms. -
Line Profile
Eables precise detection of horizontal or vertical fixed pattern noise and pixel-level anomalies along specific image rows or columns. . -
DINU(Dark Intensity Non Uniformity)
Analysis uneven pixel responses in dark regions, often indicating sensor noise or calibration issues. -
Color Analysis
enables precise evaluation of color distribution, balance, and deviations within an image. -
Color Chart Analysis
Analyzes the color values of each block in a 24-block color chart to assess accuracy and consistency. -
Lens Shading
Analyzes lens shading to detect and quantify brightness or color falloff from the center to the edges of an image. -
Defect Pixels
Analysis detects and visualizes abnormal pixels like hot, dead, or stuck ones to assess sensor issues or image quality.
-
HeatMap
Visually representing data intensity or concentration using a color gradient from cool (blue) to warm (red) tones -
Image Toggle
Allow users seamlessly switch between image states or layers to compare versions and analyze changes interactively. -
Embedded Line Viewer
Displays and analyzes line-based data embedded in images to reveal sensor behavior or diagnostic details. -
Pixel Values Export
Allows users to extract and save raw pixel intensity data from selected regions or entire images for external analysis or reporting.