HeatMap
-> go to [Analysis]

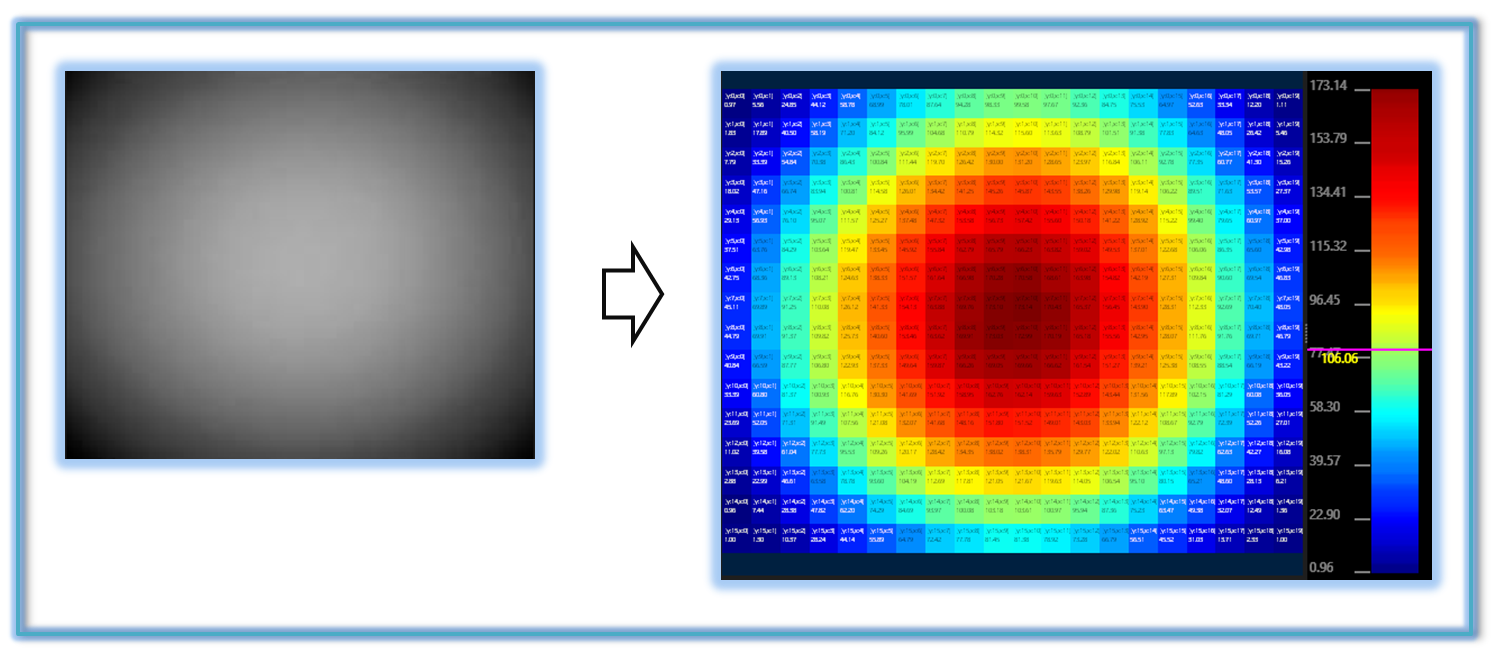
A heatmap is a visual representation where data values across an image are translated into a color gradient-typically from cool colors (e.g. blue) to warm colors (e.g. red). The goal is to highlight intensity, frequency, or concentration patterns within the image.

- LensShading
- LensShading 3D
- Shading Remover
- LensShading_Top (Parent Menu)
- Analysis (Parent Menu)

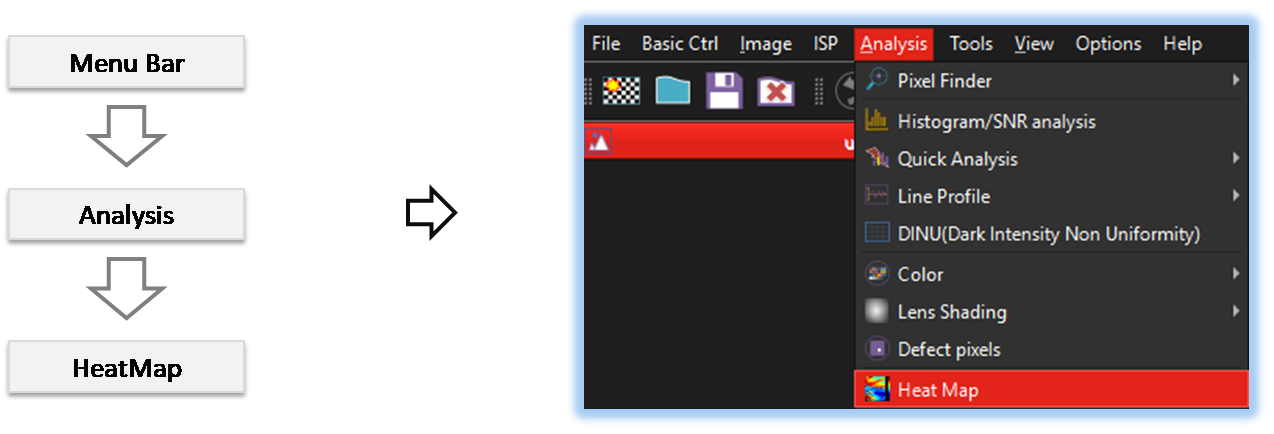
By selecting the menu options in the order shown in the image above or by choosing the toolbar icon
 , the HeatMap dialog box will be showed up as shown in below picture.
For a more detailed explanation of the toolbar button or how to configure toolbar,please refer to configure toolbar
, the HeatMap dialog box will be showed up as shown in below picture.
For a more detailed explanation of the toolbar button or how to configure toolbar,please refer to configure toolbar 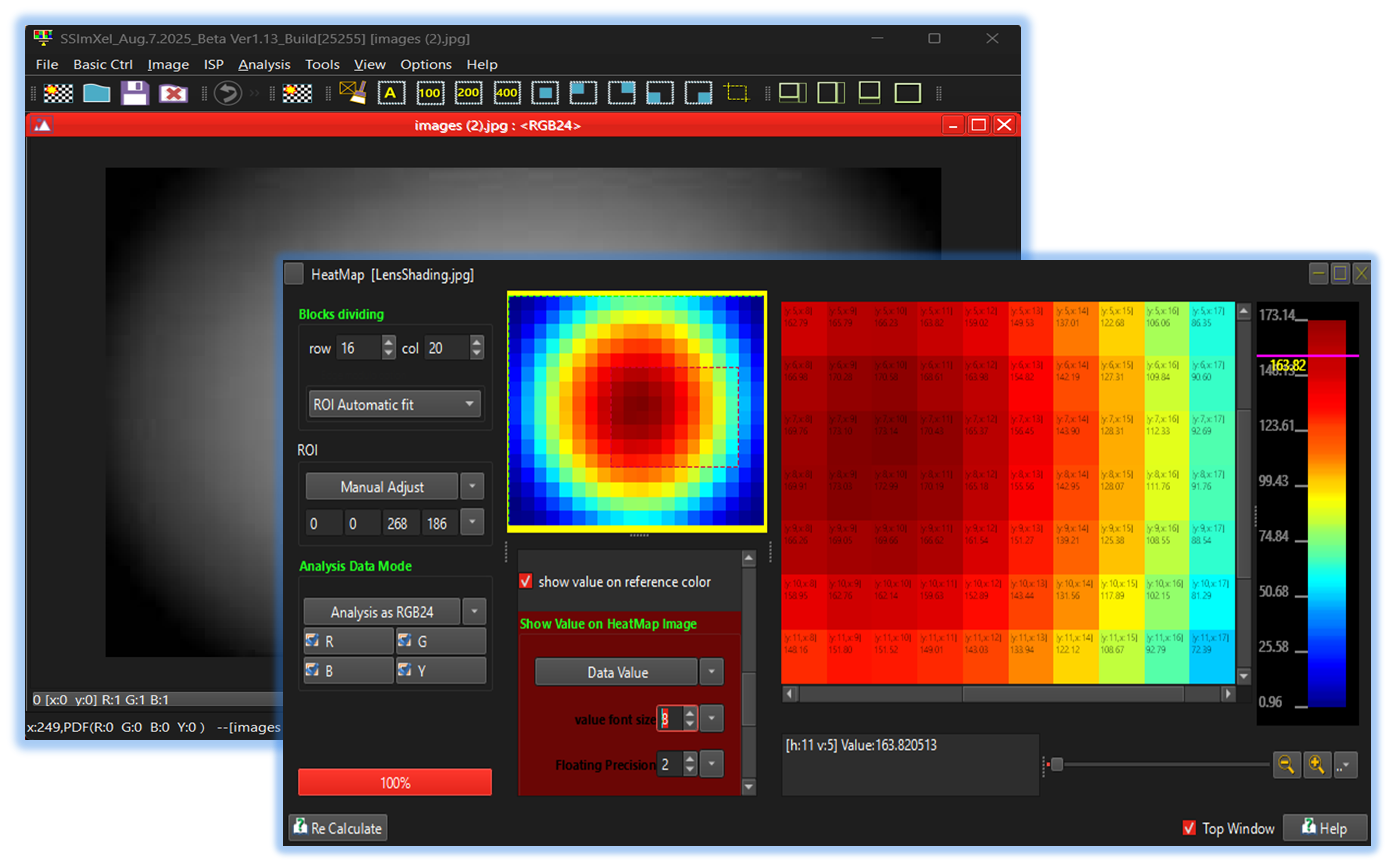



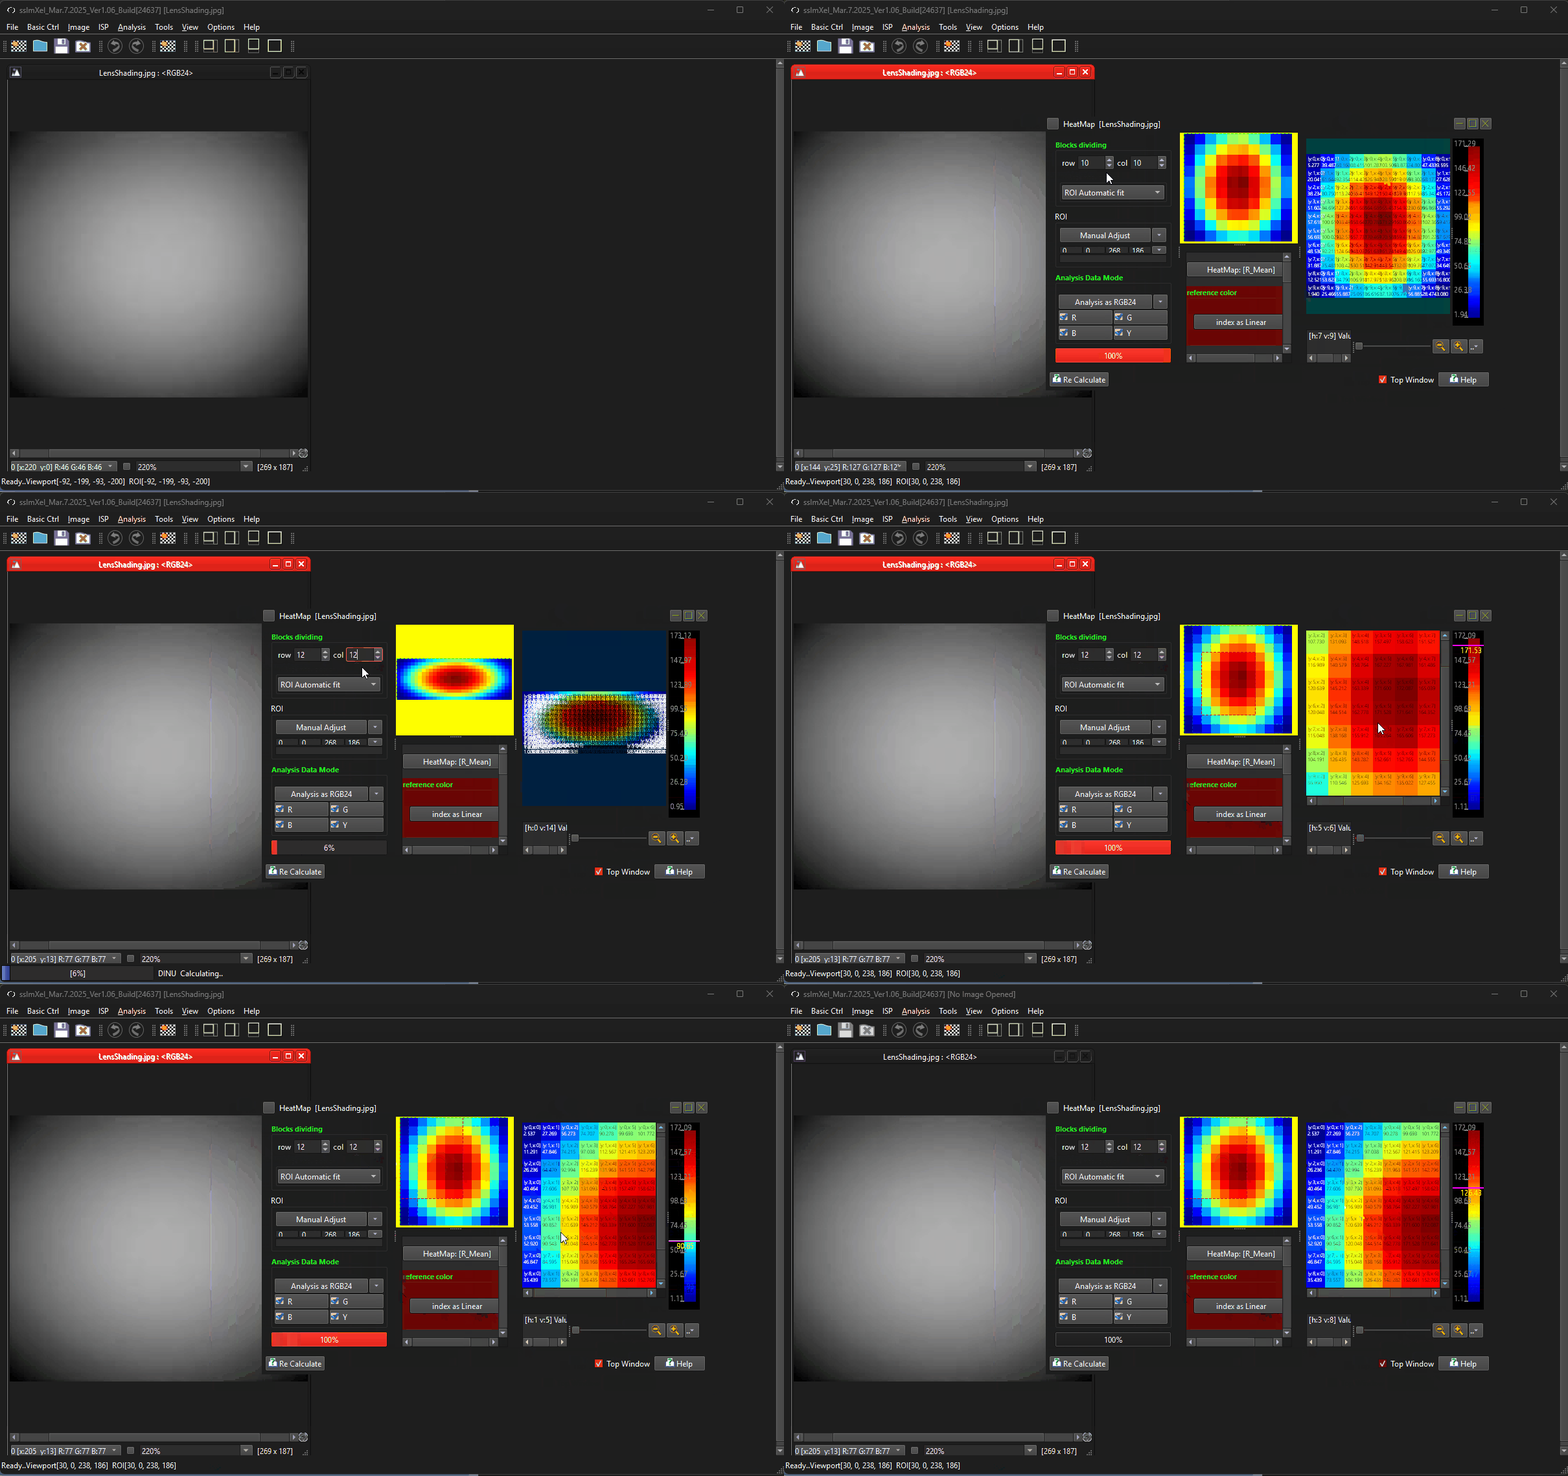
Below demo demonstrates HeatMap
 .
.