Quick Analysis - Singal and Noise
-> go to [KeyFeatures]

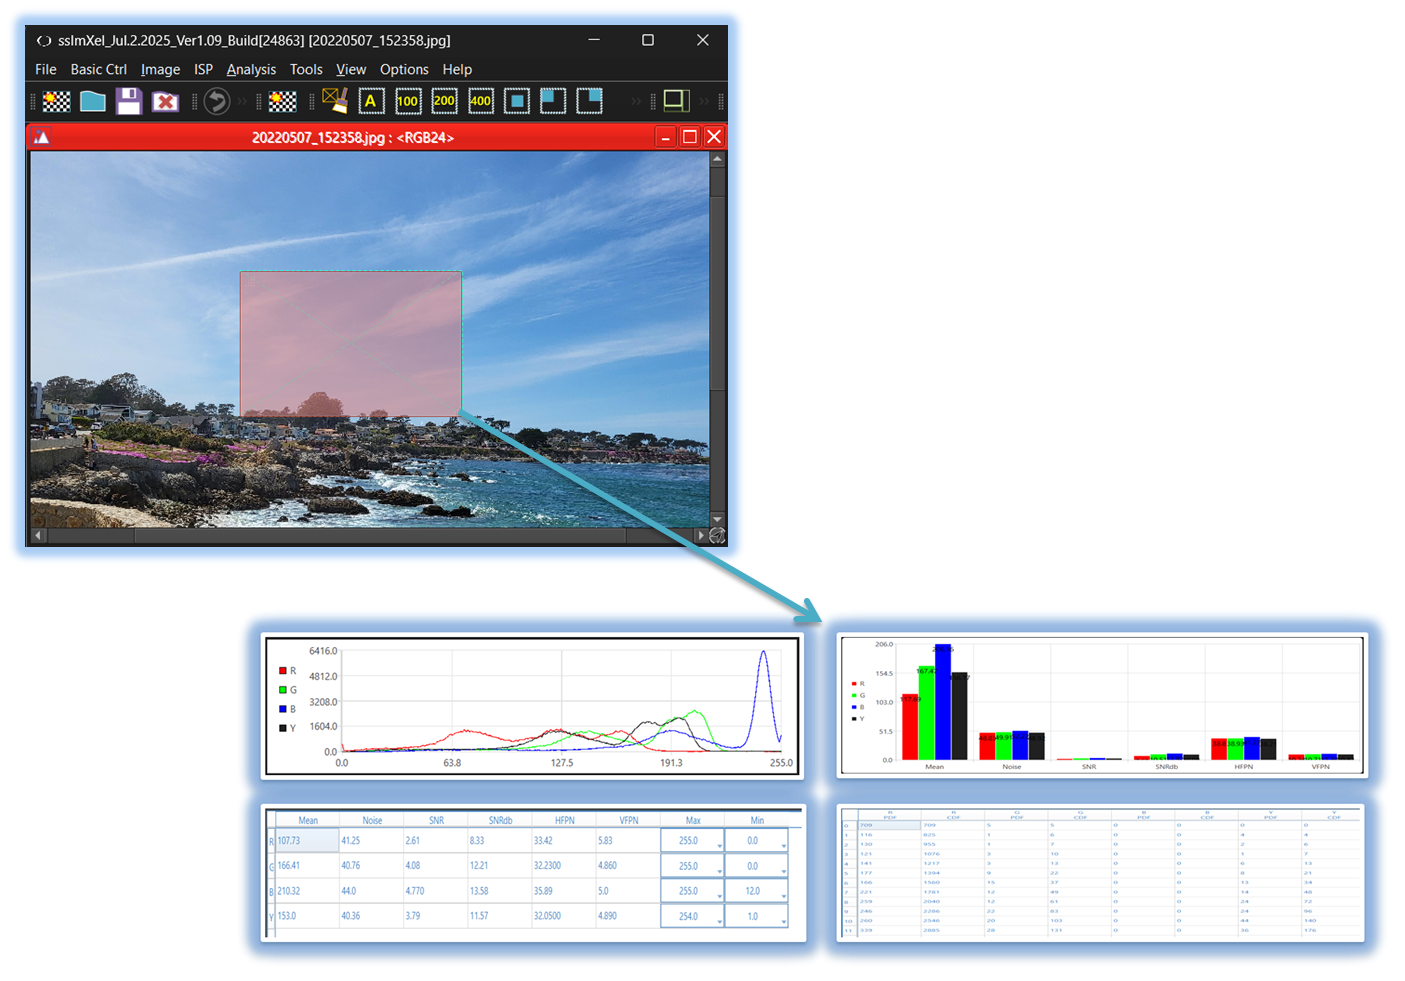
In many cases of image analysis, users need to check the signal or noise in specific areas of an image. Additionally, when analyzing multiple images, users often need to compare signal or noise for the same region of interest (ROI) across these images. SSImXel provides a convenient and easy solution for this need.

- Quick Analysys Location, Show/Close.
- Docking window
- Docking window Show/Hide
- Histogram analysis
- Line Profile
- DINU/DSNU analysis
- KeyFeatures (Parent Menu)

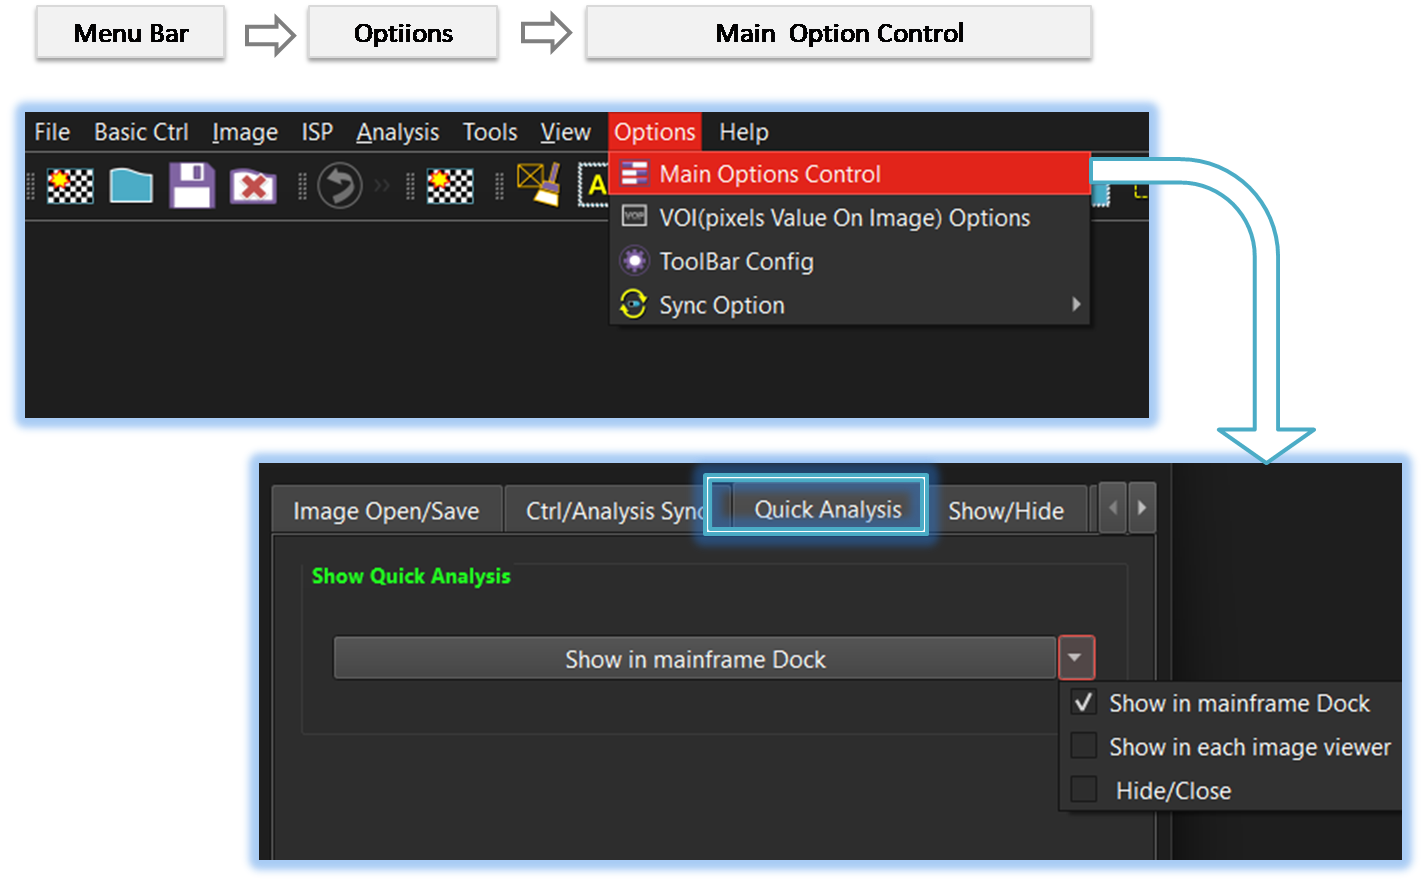
The user can start Quick Analysis by selection Main Options control -> 'Quick Analysis' tab, as shown in the picture above. Through this option, the user can also specify the location of the Quick Analysis window or close it if desired. For more detailed information, please refer to the following link-> [Quick Analysys Location, Show/Close]
When using the quick analysis feature within the mainframe docking area, refer to the following link-> [Docking window Show/Hide]

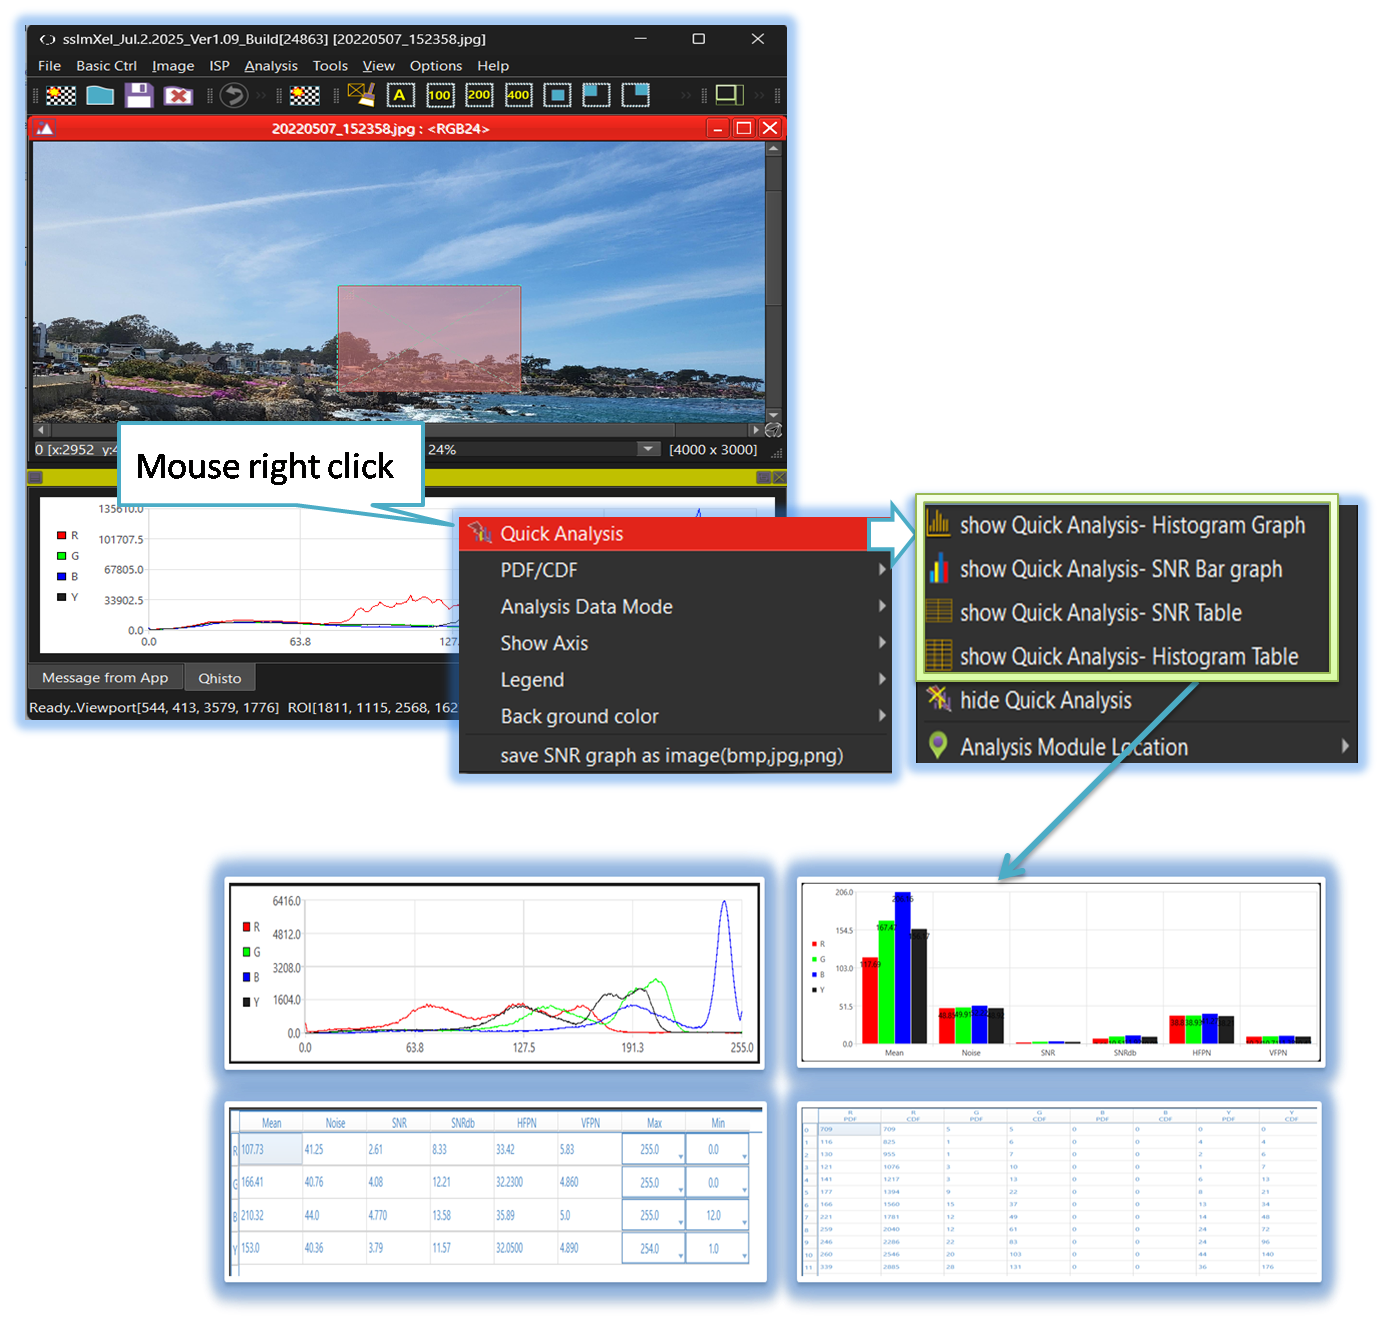
When the user right-clicks within the Quick Analysis window, a context menu appears, offering various analysis-related options. Through this menu, the user can access multiple analysis tools such as histogram graphs, signal-to-noise bar charts, and tables. Additionally, the user can configure a range of analysis-related settings from this menu.

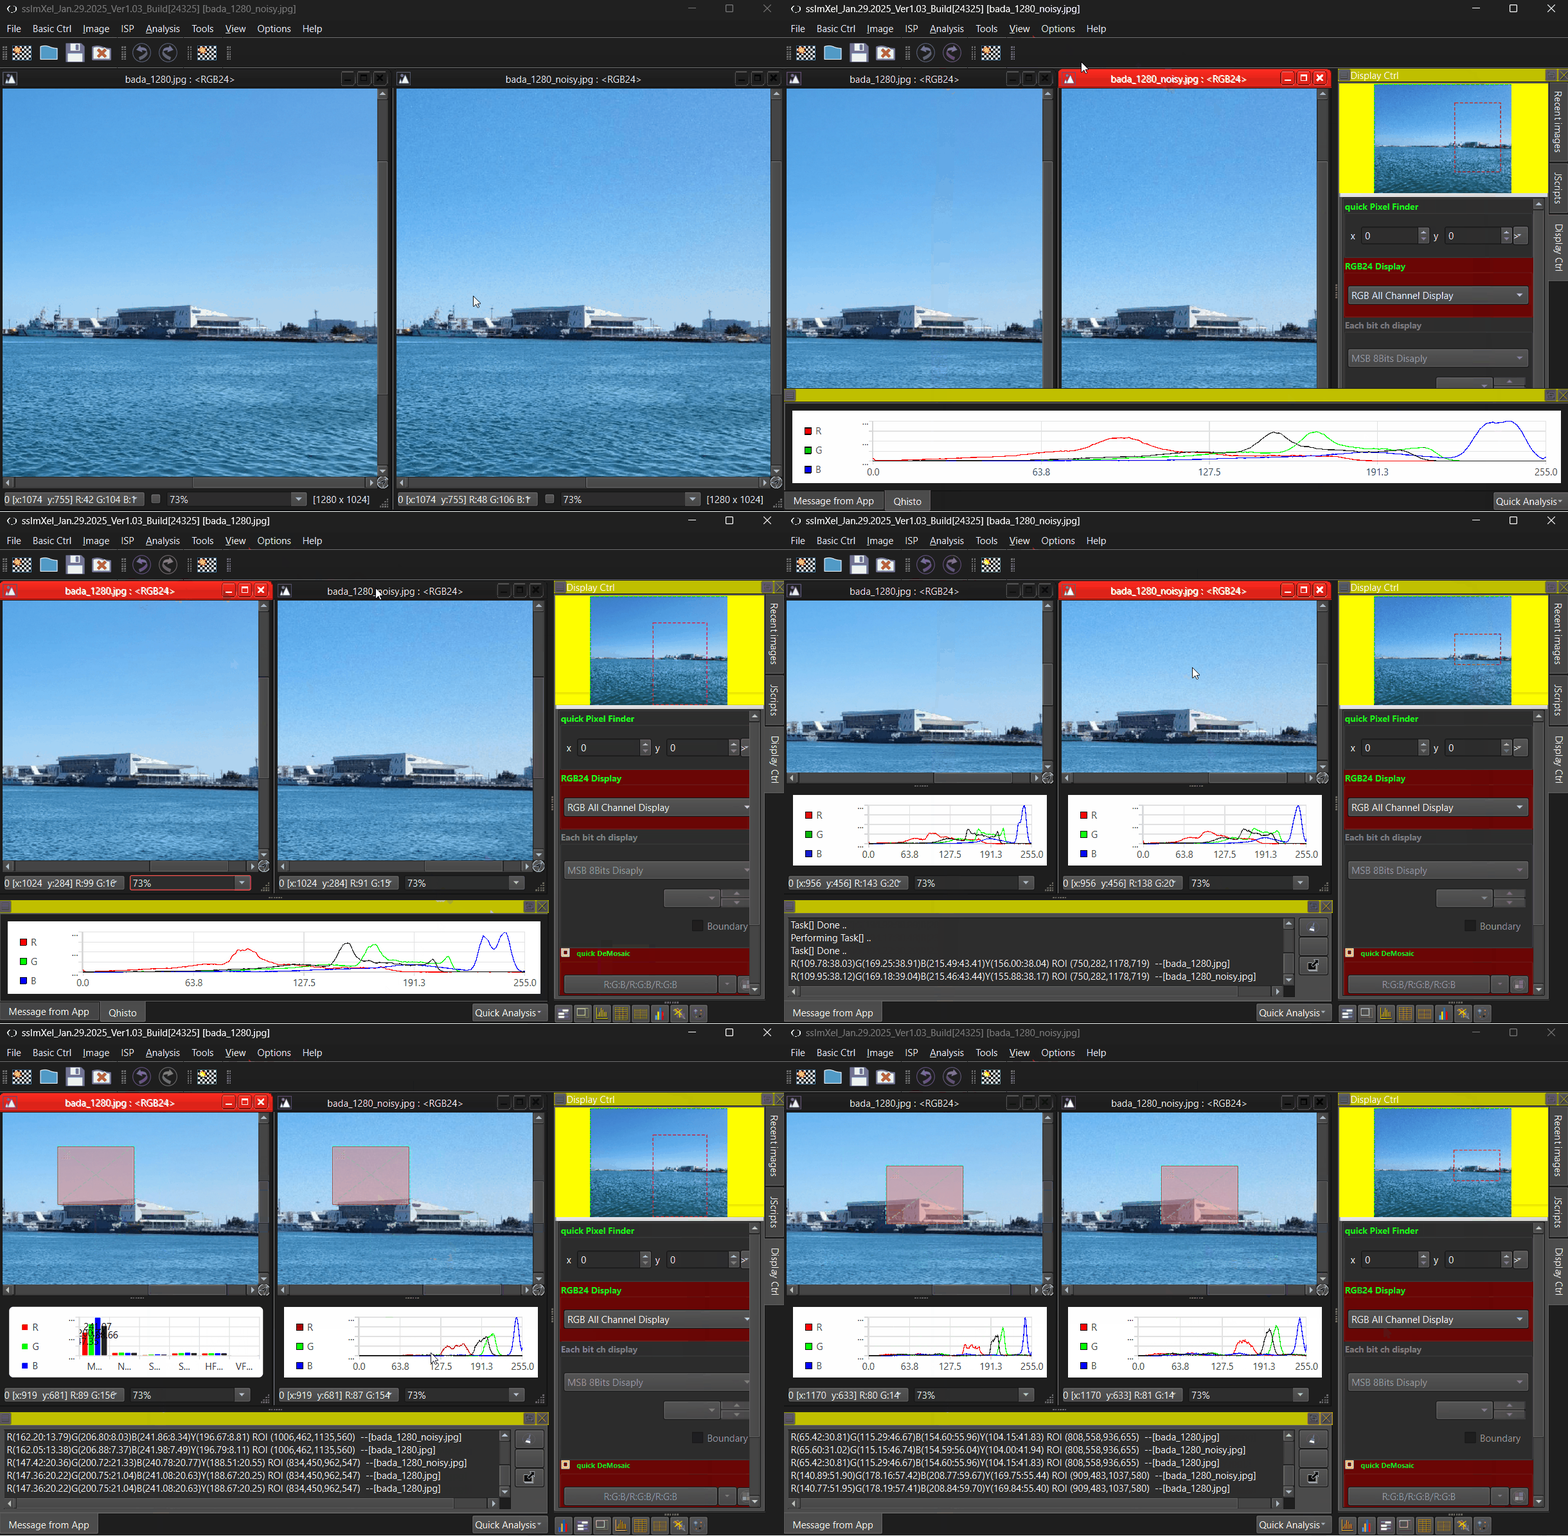
Below demo demonstrates QuickAnaly
 .
.